 texus Addons und Themes
Usage Statistics
CPU, memory, disk and network history per server and node, graphs for admins and users, Prometheus export.
9,99 €
- Version 0.1.0, updated 11 October 2026
- For Pterodactyl Panel 1.15.x with Blueprint
- No core files modified, installs and removes with Blueprint
- One licence for one panel, new versions included
Screenshots
Features
Pterodactyl only shows what a server uses right now. Which server ate the node's memory last night, how full a node was over the last month, which servers cause the most traffic: once the console is closed, the numbers are gone. Usage Statistics records them and shows them as graphs.
Collected for you
- CPU, memory, disk, network traffic and state of every server, every minute or every five minutes
- One request per node: Wings lists all its servers with their usage in one answer, all nodes are asked at the same time
- Node totals for every moment, offline nodes are detected and skipped
- Every sample kept for 24 hours, 15-minute averages for 30 days, hourly averages for a year, peaks included; all periods adjustable
For admins
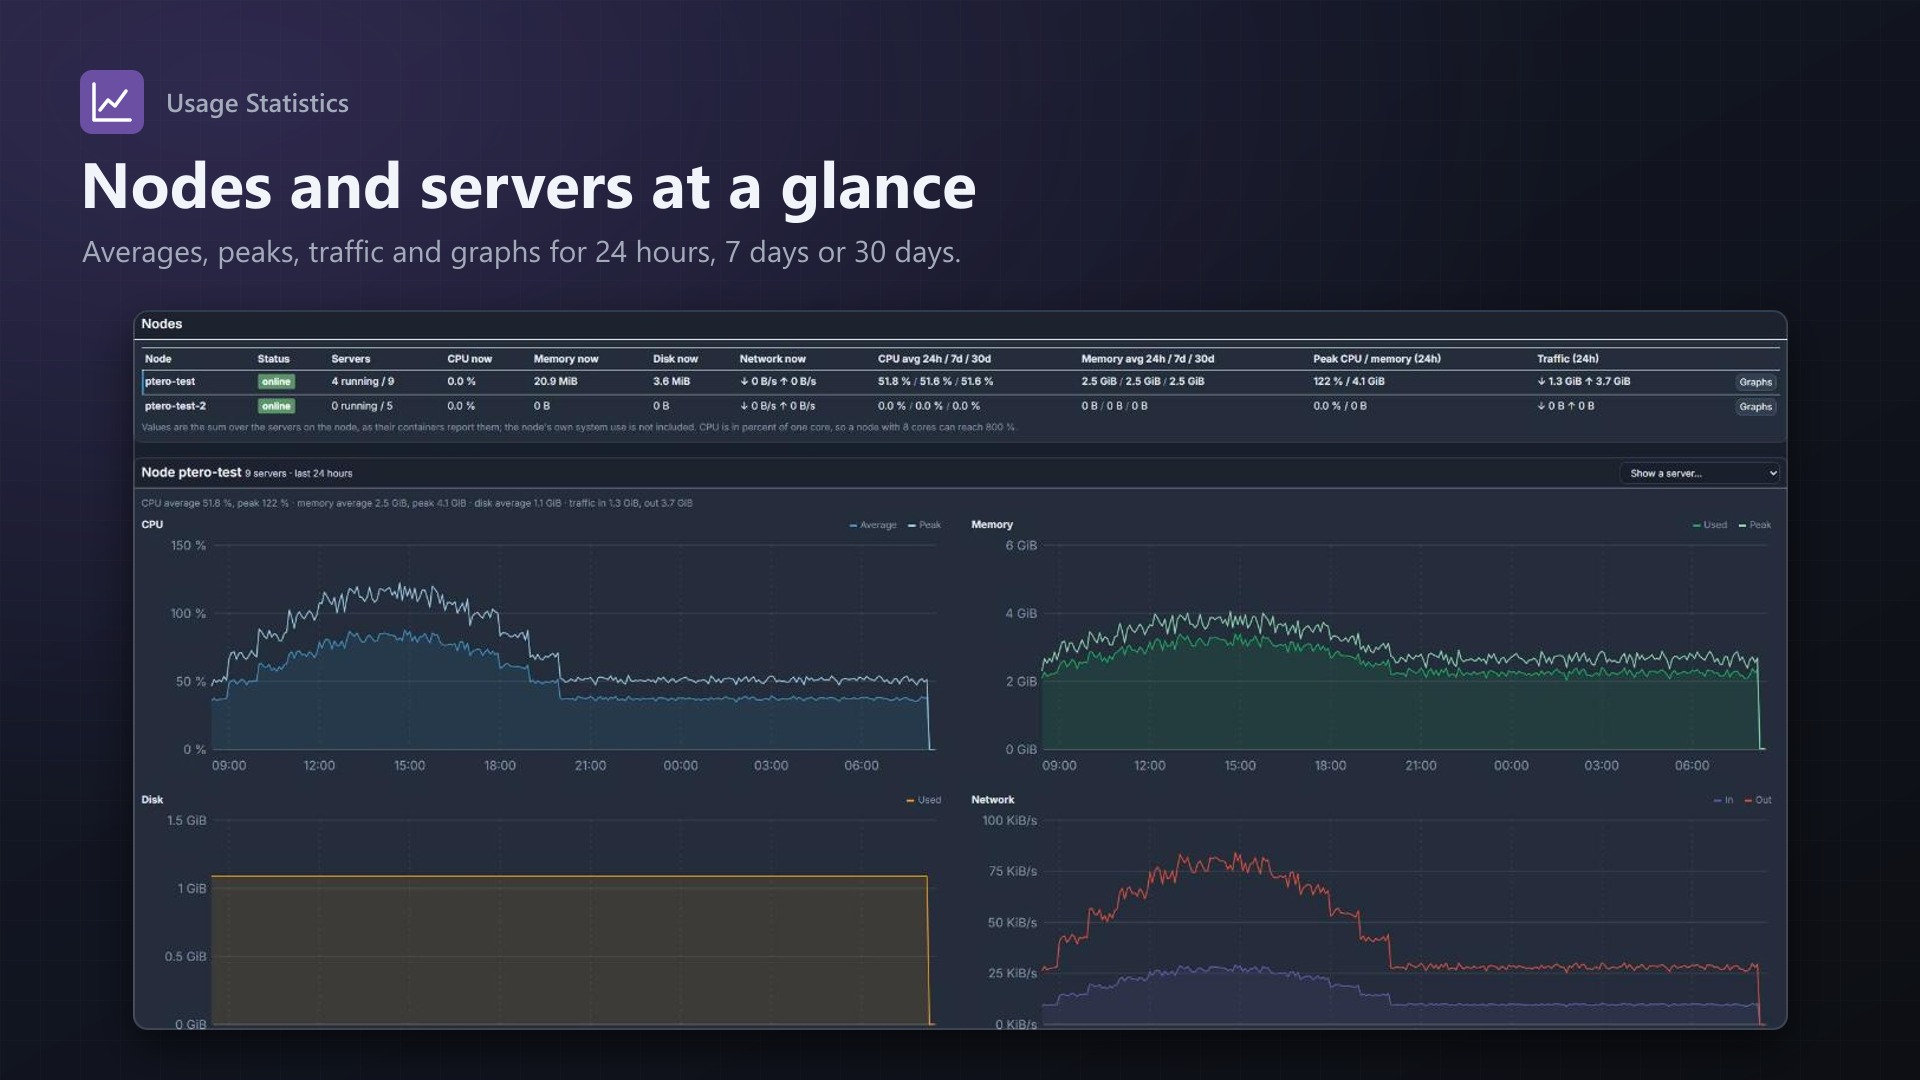
- Node overview: status, running servers, CPU, memory, disk and network now, averages over 24 hours, 7 days and 30 days, peaks and traffic
- Top servers by CPU, memory, disk and traffic
- Graphs for every node and every server: 24 hours, 7 days or 30 days
- Drawn on the server, no external scripts or CDNs
For your users
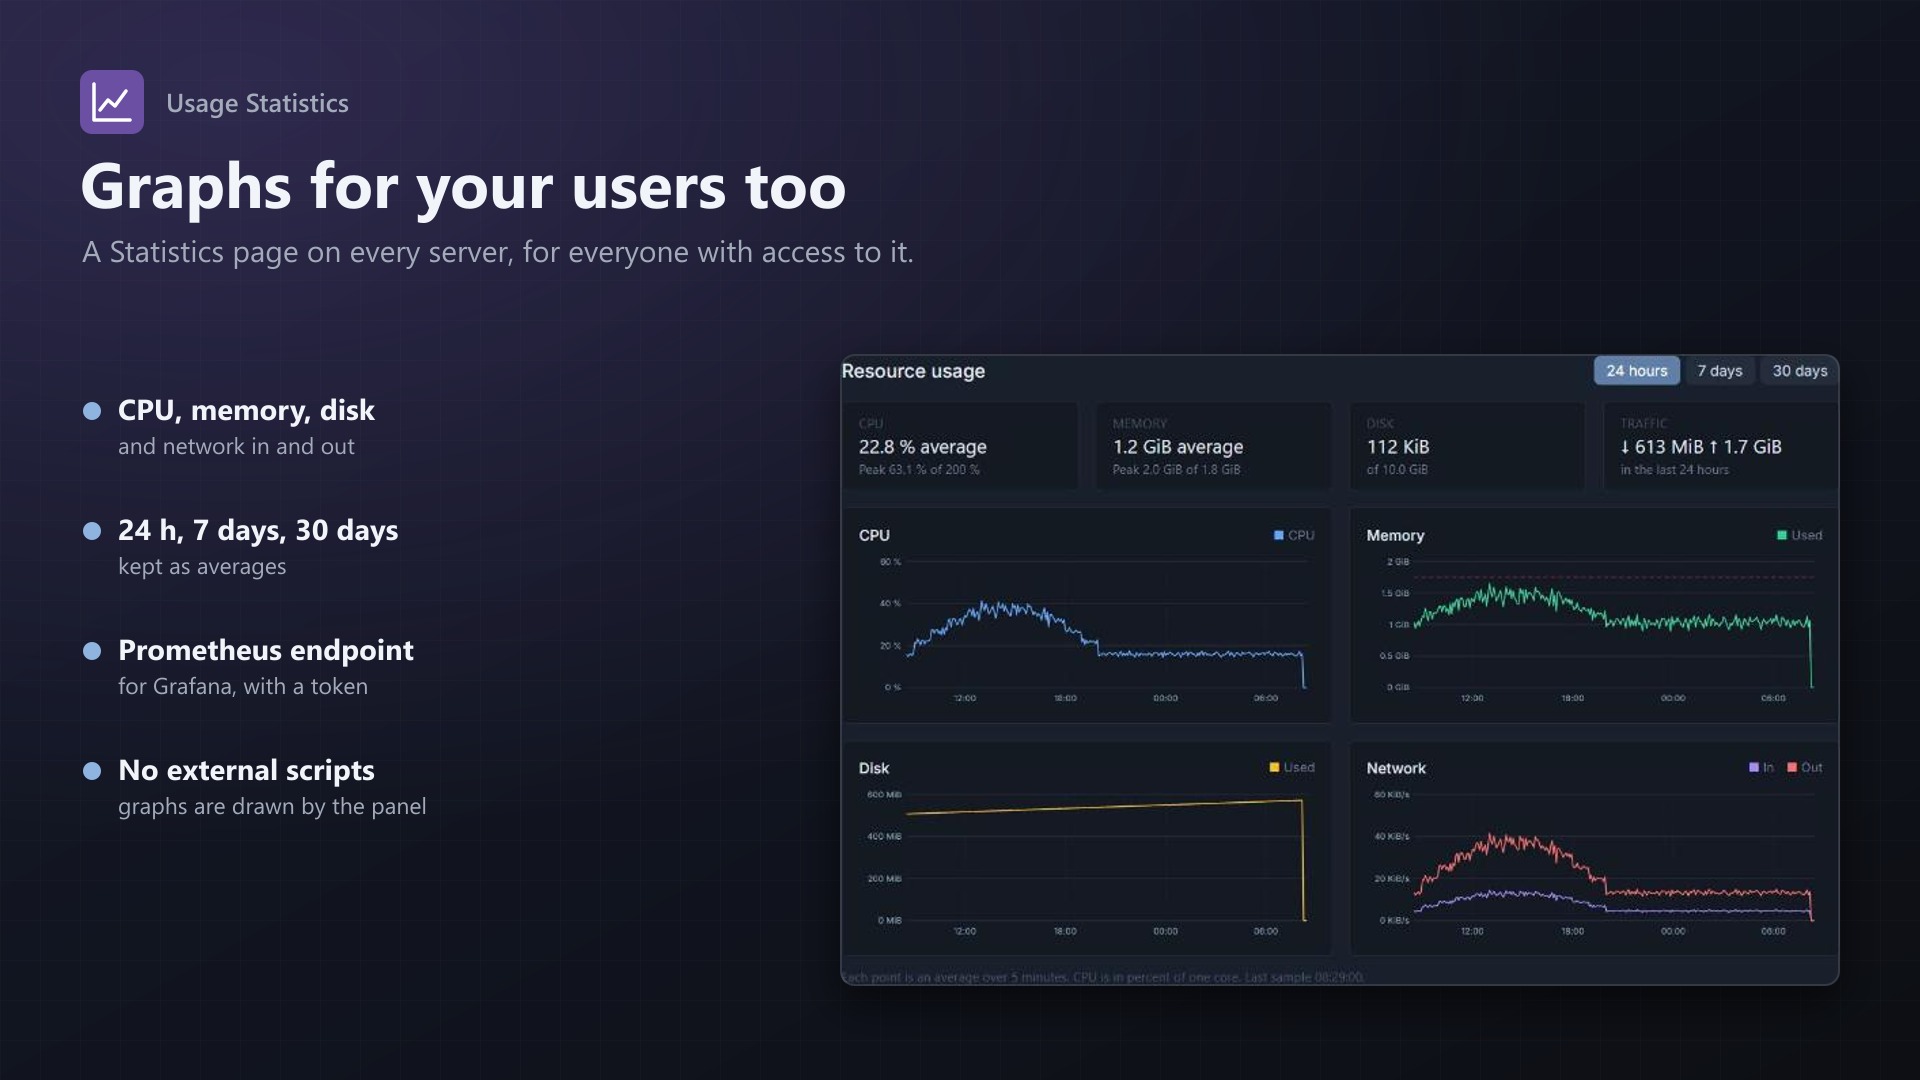
- A Statistics page on every server: CPU, memory, disk and network graphs with averages, peaks and limits
- Only for the owner, subusers and admins of the server
Prometheus and Grafana
- Metrics endpoint with a bearer token (stored hashed, shown once, new one at a click)
- Per server: CPU, memory, memory limit, disk, network counters, running, uptime; per node totals and up/down; servers and nodes in total
- Scrape config to copy and Grafana query examples on the admin page
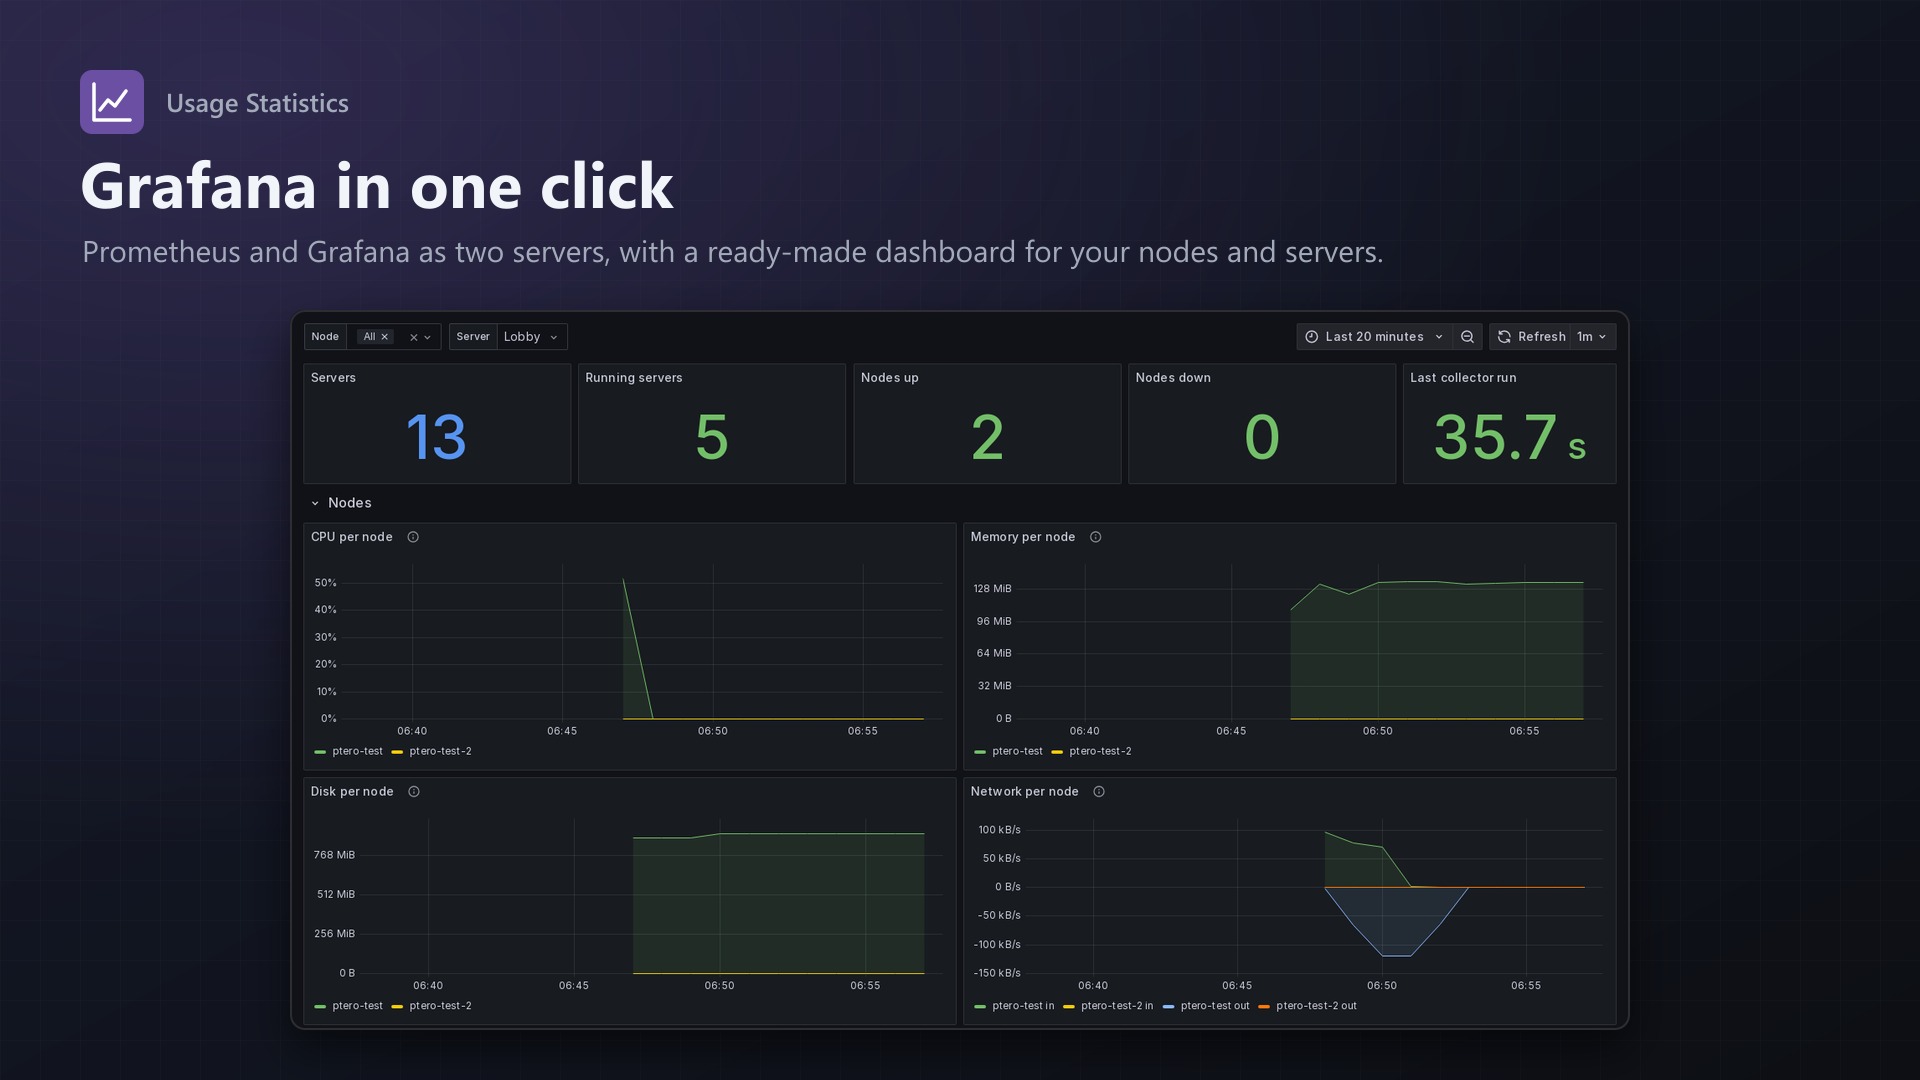
- Grafana in one click: creates Prometheus and Grafana as two servers in the panel, with the data source and a ready-made dashboard
- No core files modified
Documentation
A Blueprint extension that keeps a history of the resource usage of every server and node in Pterodactyl, shows it as graphs and exports it for Prometheus and Grafana.
Pterodactyl only shows what a server uses right now. Once the console page is closed, the numbers are gone: which server ate the node's memory last night, how full a node was over the last month, or which servers cause the most traffic is nowhere to be seen. Usage Statistics records it.
How it works
- Collecting. A scheduled job asks Wings for the usage of all servers, every minute or every five minutes. Wings lists all its servers with their usage in one answer, so it is one request per node, and all nodes are asked at the same time with a short timeout. For each server it stores CPU, memory (and the container's memory limit), disk, network traffic and whether it was running. The node totals are the sum over its servers at the same moment.
- Keeping it small. Every sample is kept for 24 hours. Once an hour, completed periods are averaged into 15-minute values (kept 30 days) and those into hourly values (kept one year). Peaks are kept with the averages, traffic is summed. All periods can be changed in the settings.
- Looking at it. Admins get an overview of all nodes, top lists and graphs; users get a "Statistics" page on each of their servers.
Admin page
Under Admin > Extensions > Usage Statistics, for the last 24 hours, 7 days or 30 days:
- Nodes: online or offline, running servers, CPU, memory, disk and network right now, average CPU and memory over 24 hours, 7 days and 30 days, peaks and traffic in the chosen range.
- Graphs for a node or a single server: CPU, memory, disk and network (in and out), with averages and peaks. The graphs are drawn on the server as SVG; hover over them to see the values.
- Top servers by CPU, memory, disk and traffic, each linking to the server's graphs.
- Prometheus: create the metrics token, scrape config to copy, Grafana query examples.
- Grafana dashboard: Prometheus and Grafana with a ready-made dashboard as two servers, in one click.
- Settings: collection interval and how long each resolution is kept.
Server page
Every server gets a Statistics page next to Console, Files and the others: CPU, memory, disk and network graphs for 24 hours, 7 days or 30 days, with averages, peaks and the server's limits. It is available to the owner, the server's subusers and admins, and updates once a minute.
Prometheus and Grafana
The endpoint is https://your-panel/extensions/texusstats/metrics. Create a token on the admin page; it is shown once and only its hash is stored. Creating a new token makes the old one stop working, removing it closes the endpoint.
scrape_configs:
  - job_name: pterodactyl
    scrape_interval: 60s
    scheme: https
    metrics_path: /extensions/texusstats/metrics
    authorization:
      type: Bearer
      credentials: <your token>
    static_configs:
      - targets: ['panel.example.com']
Per server (labels server = UUID, name, node): pterodactyl_server_cpu_percent, pterodactyl_server_memory_bytes, pterodactyl_server_memory_limit_bytes, pterodactyl_server_disk_bytes, pterodactyl_server_network_rx_bytes_total, pterodactyl_server_network_tx_bytes_total, pterodactyl_server_running (1 or 0), pterodactyl_server_uptime_seconds.
Per node (label node): pterodactyl_node_up, pterodactyl_node_servers, pterodactyl_node_servers_running, pterodactyl_node_cpu_percent, pterodactyl_node_memory_bytes, pterodactyl_node_disk_bytes, pterodactyl_node_network_rx_bytes_per_second, pterodactyl_node_network_tx_bytes_per_second.
Panel-wide: pterodactyl_servers_total, pterodactyl_servers_running, pterodactyl_nodes_total, pterodactyl_nodes_up, pterodactyl_stats_last_collect_timestamp_seconds.
The values are those of the last collector run. Servers on a node that did not answer are left out until the node is back. The network counters come from Wings and start at zero when a server starts; Prometheus' rate() handles that.
Grafana in one click
The box Grafana dashboard on the admin page sets up Prometheus and Grafana as two servers in the panel. Pick a node with two free addresses, the owner (you by default, or any user you search for), memory and disk of both servers (Prometheus 512 MB / 5 GB, Grafana 512 MB / 2 GB) and how many days Prometheus keeps (30), then click Create Prometheus and Grafana:
- The nest Monitoring is created if it doesn't exist, and the eggs "Prometheus (Usage Statistics)" and "Grafana (Usage Statistics)" shipped with the extension are imported into it, or updated to the shipped version if they are already there.
- Prometheus gets its own metrics token. Your own token on the admin page keeps working; either one opens the endpoint, only their hashes are stored.
- The Prometheus server downloads Prometheus 2.53 (LTS) and scrapes
https://your-panel/extensions/texusstats/metricsas often as the collector runs. - The Grafana server downloads Grafana OSS 11.6, has Prometheus as its default data source and the dashboard Pterodactyl (folder "Pterodactyl"): servers, running servers, nodes up and down, CPU, memory, disk and network per node, the top 10 servers by CPU and memory, and the graphs of one server picked from a list. The dashboard is fetched from the panel on every start, so an update of the extension brings it up to date.
Both servers install and start on their own. The admin page then shows the Grafana address (http://address:port), the username admin and the generated password, once. Later you find the password under the Grafana server's Startup variables; changing it there takes effect at the next restart. The box keeps links to both servers; Set up again creates two new servers and a new Prometheus token (the old servers are not deleted, but their Prometheus gets no more data).
Grafana is served over plain HTTP on its port. Open that port only for yourself in the firewall, or put Grafana behind a reverse proxy with HTTPS, for example with our Custom Domains extension. Prometheus needs no public access, but Grafana must reach it on its address. If an address is 0.0.0.0, the node's FQDN is used. The servers need outgoing HTTPS to GitHub and dl.grafana.com for the install, and Prometheus must reach the panel.
Good to know
- CPU is in percent of one core, as Pterodactyl shows it: a server using two full cores shows 200 %.
- Node values are the sum over the servers' containers. The node's own system load is not included.
- A node that doesn't answer three times in a row is only tried every five minutes until it is back.
- Without Wings' server list (very old Wings versions), each server is asked on its own.
- With the default settings, a panel with 500 servers stores about 720,000 samples for the last 24 hours plus about 1.4 million 15-minute and 4.4 million hourly averages. Shorten the retention for very large panels if the database is small.
- No core files are modified.
Requirements
- Pterodactyl Panel 1.15.x with Wings 1.11 or newer on all nodes
- Blueprint (beta-2026-08 or newer)
- The panel's cron job (
schedule:runevery minute), as Pterodactyl needs it anyway - A licence key from texus-addons.de, free with your purchase, for one panel
- Outgoing HTTPS from the panel to texus-addons.de
Installation
- Upload
texusstats.blueprintto/var/www/pterodactyl - Run
blueprint -install texusstats - Enter the licence key under Admin > Extensions > Usage Statistics
Changelog
0.1.0
- First release: collects CPU, memory, disk, network and state of every server from Wings every one or five minutes (one request per node), keeps 15-minute and hourly averages for longer, shows node overviews, top servers and graphs for 24 hours, 7 days and 30 days on the admin page, a "Statistics" page for each server, and a Prometheus endpoint with a bearer token.
- Grafana in one click: imports Prometheus and Grafana eggs into the nest "Monitoring" and creates both servers, with their own metrics token, the data source and a ready-made Pterodactyl dashboard.
- Update notice: when a newer version is out, Admin > Extensions and the licence box on the admin page show it, with what is new. With the optional update helper (set up once as root), the update runs with one click after a backup of the panel files and the database.
Licence and download
One purchase = one licence = one panel. The licence is bound to one panel domain and the server it runs on. Subdomains count separately. You can move the licence at any time in your account.
After buying on sourceXchange or BuiltByBit, sign in here with your email address (BuiltByBit: redeem your activation code). You download the extension with the licence key built in, and every new version from your account.
Questions before buying? Ask on our Discord support server or at support@texus-addons.de.
Related
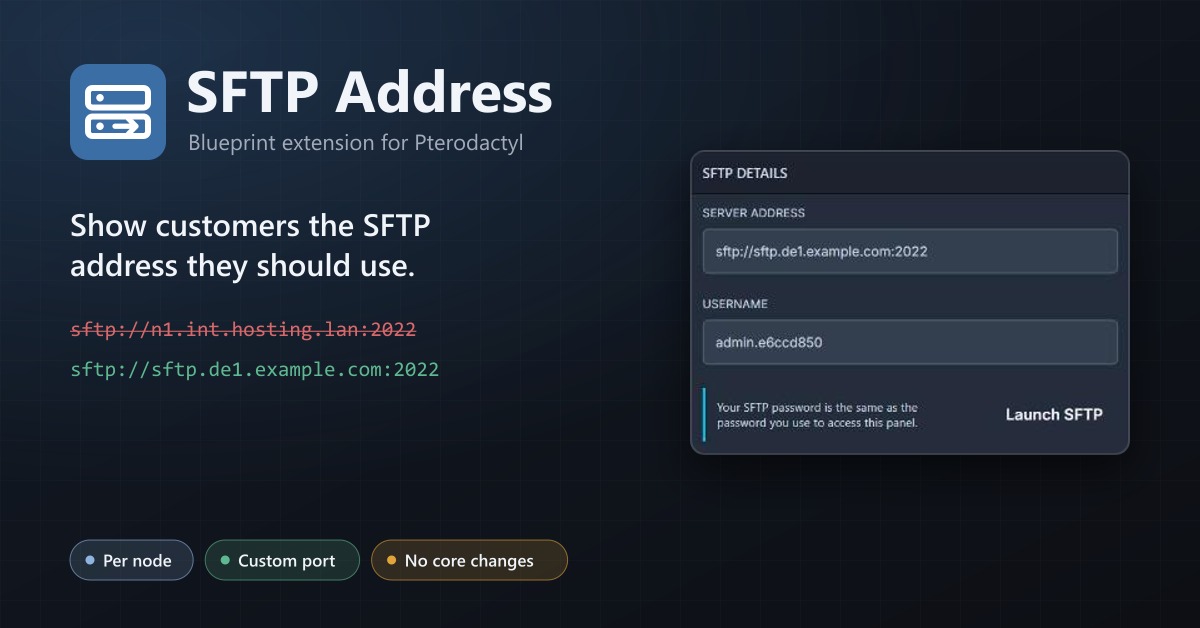
SFTP Address
Show your users a public SFTP address per node, like sftp.de1.example.com, instead of the node's internal address.
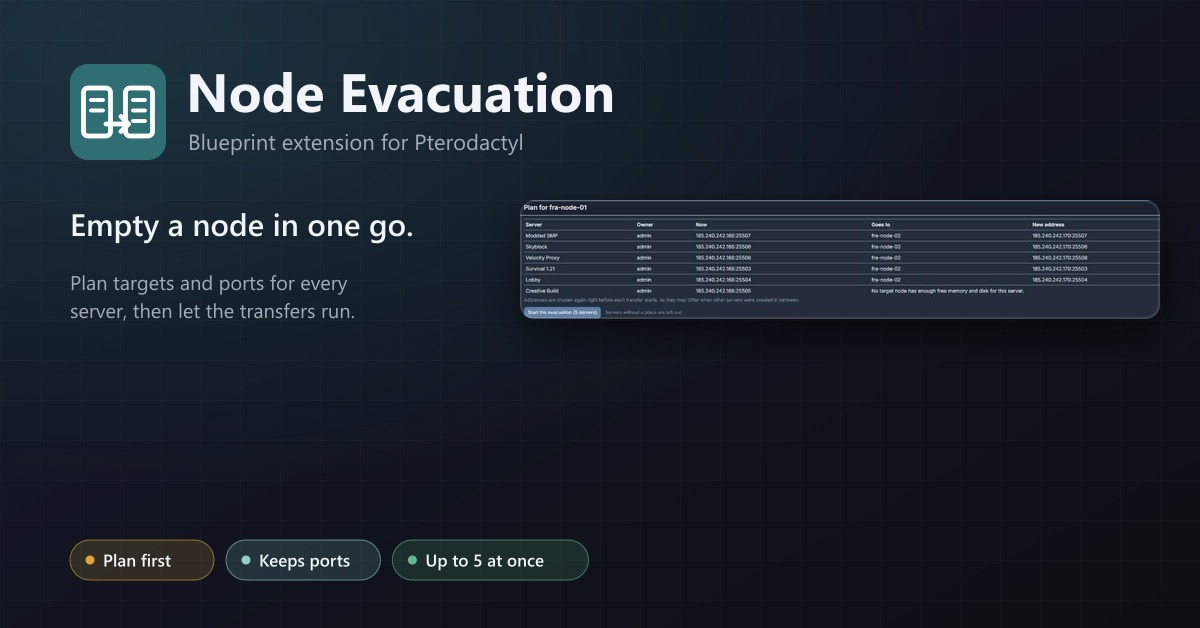
Node Evacuation
Empty a node in one go: plan targets and ports, then transfer every server with progress, retries and a stop button.
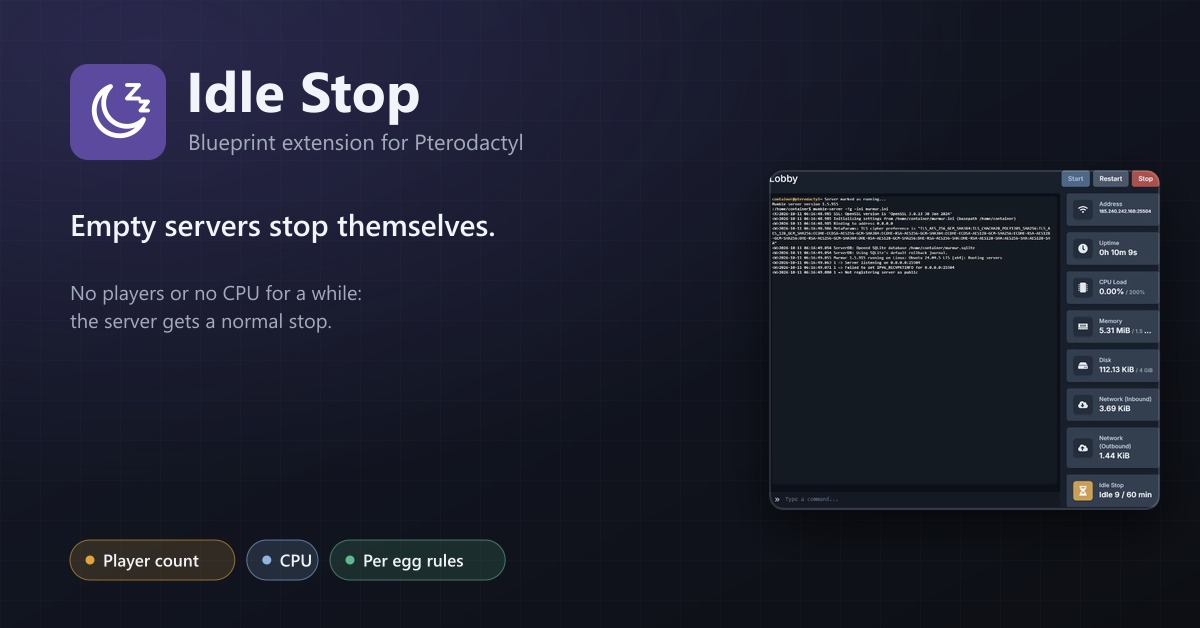
Idle Stop
Stop servers nobody plays on: player count or CPU based, per egg rules, users can opt out if you allow it.