 texus Addons und Themes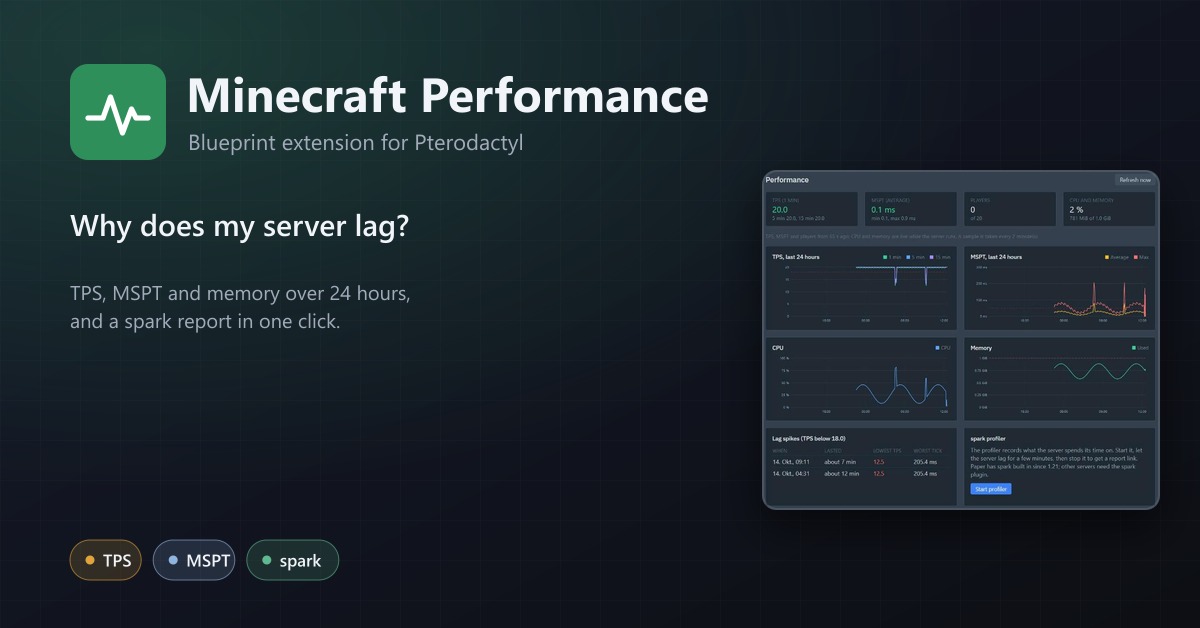
Minecraft Performance
TPS, MSPT, players and memory per Minecraft server with 24 hours of history, lag spikes and the spark profiler in one click.
12,99 €
- Version 0.1.0, updated 14 October 2026
- For Pterodactyl Panel 1.15.x with Blueprint
- No core files modified, installs and removes with Blueprint
- One licence for one panel, new versions included
Screenshots
Features
"The server is lagging" is the most common ticket of a Minecraft host, and nobody can say why. Minecraft Performance adds a Performance tab to the server page, so customers see it themselves.
See what the server is doing
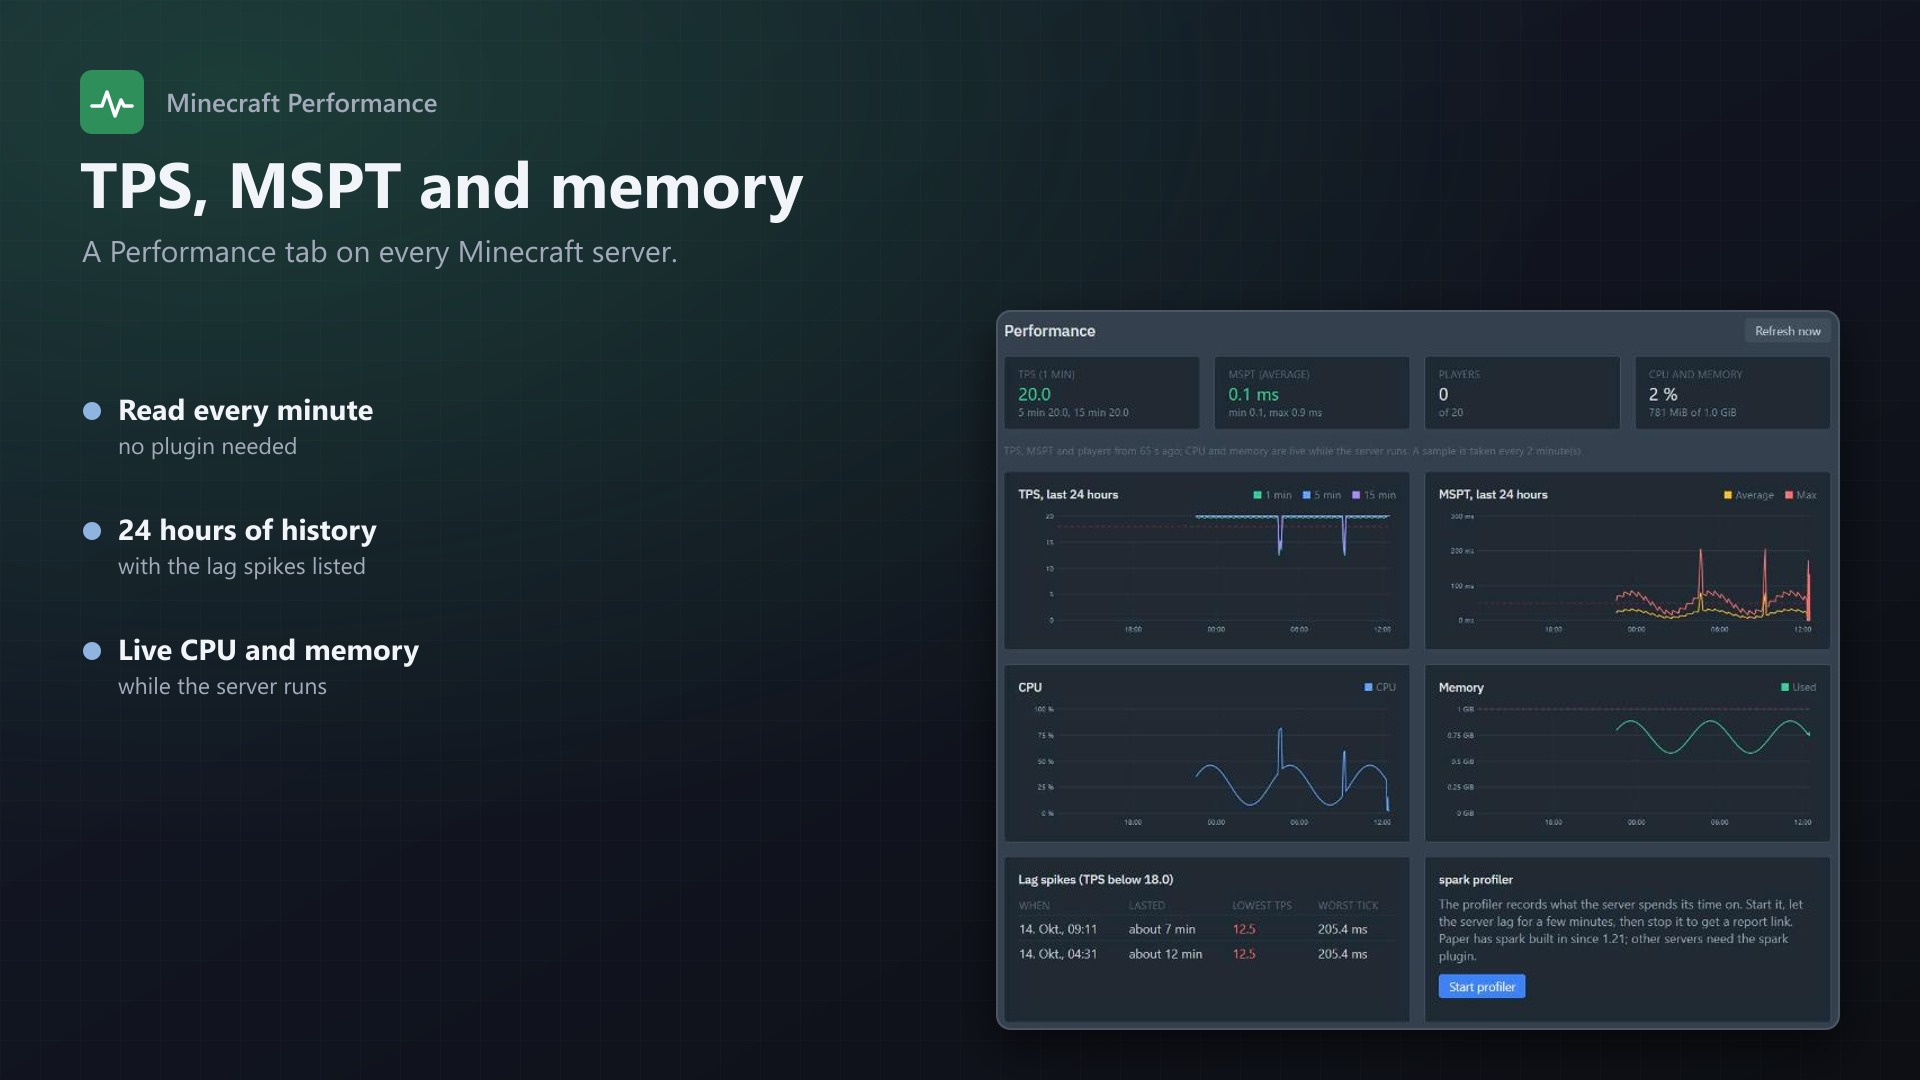
- Live TPS (1, 5 and 15 minutes) and MSPT (average, minimum, maximum), players online, CPU and memory
- 24 hour history of TPS, MSPT, CPU and memory, with the lag threshold drawn in
- Lag spike list: when the TPS fell below your threshold, for how long, how low and the worst tick
- No plugin needed on Paper, Purpur and Spigot: the panel sends the console commands through Wings and reads the answer from the console log, also while nobody has the page open
Find the cause with spark
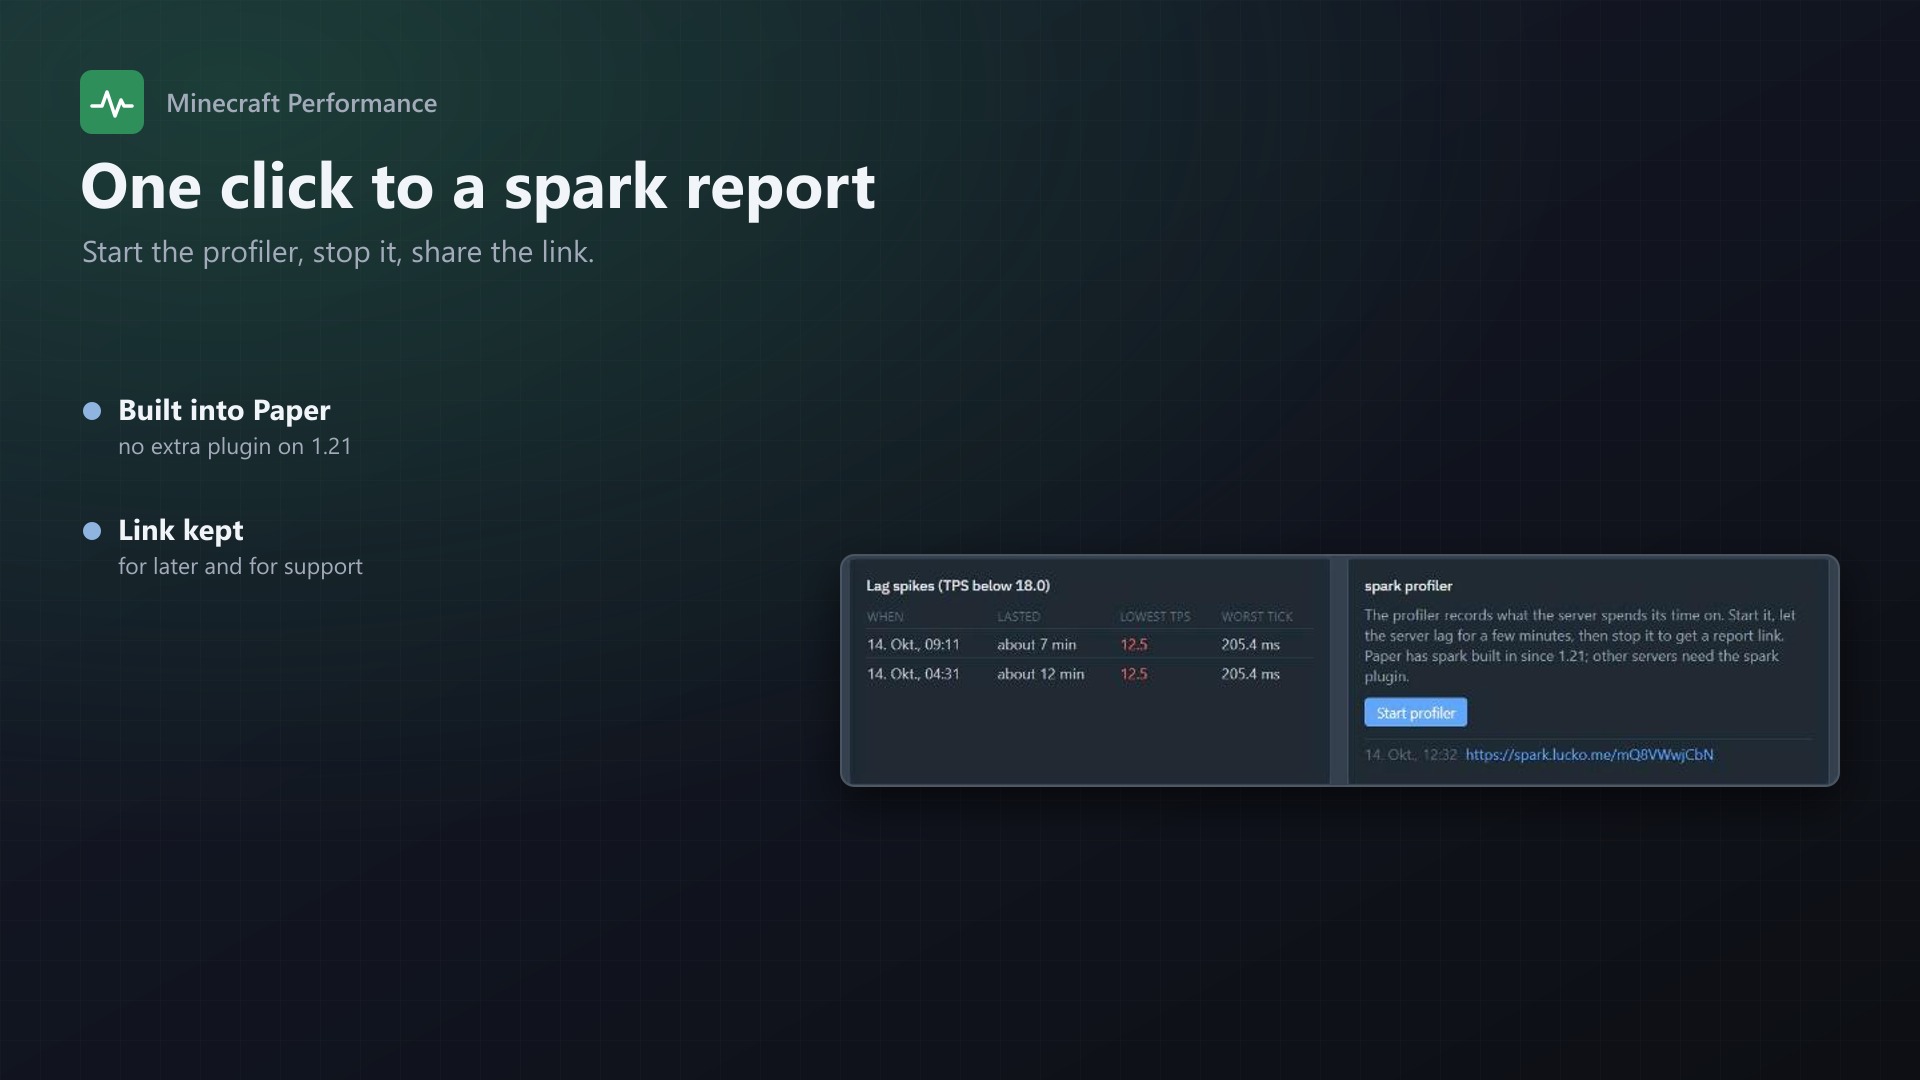
- Start profiler and Stop and get report at the click of a button, the spark.lucko.me link appears on the page
- Earlier reports stay in a list; a hint shows when spark is not installed (Paper has it built in since 1.21)
Under your control
- Detects Minecraft Java eggs by name, or only the nests and eggs you choose
- Sample interval, retention time and spike threshold are yours to set
- Seeing the tab needs console access, commands need the console permission; profiler runs go to the activity log
- Servers that never answer
tps(vanilla, Forge, Fabric) are asked less and less often - Uses Wings' own API, no core files modified
Documentation
A Blueprint extension that tells customers why their Minecraft server lags.
A player says "the server is slow", and nobody can say why. Minecraft Performance adds a Performance tab to the server page of Minecraft Java servers: how many ticks per second the server really runs, how long a tick takes, how many players are on, what CPU and memory do, when it lagged, and a spark profiler report at the click of a button. Customers answer their own questions, and your support gets fewer tickets that start with "lag".
What customers see
- Live figures: TPS over 1, 5 and 15 minutes, MSPT (average, minimum, maximum), players online and the panel's CPU and memory, live while the server runs.
- History: graphs of TPS, MSPT, CPU and memory for the last 24 hours, with the spike threshold drawn in.
- Lag spikes: a list of the times the TPS fell below your threshold, with how long it lasted, the lowest TPS and the worst tick.
- spark profiler: "Start profiler" runs
spark profiler start, "Stop and get report" runsspark profiler stopand shows thehttps://spark.lucko.me/...link when spark has uploaded the report. Earlier reports stay in a list. If spark is not installed, the page says so. Paper has spark built in since 1.21; on other servers add the spark plugin. - Refresh now: takes a sample immediately instead of waiting for the next one.
How it works
No plugin is needed. Every few minutes a scheduled job looks at the running servers of the covered eggs:
- It sends
list,tpsandmsptto the server with Wings' command API, the same call the panel's console uses. - It reads the answer from the console log that Wings keeps (
GET /api/servers/{uuid}/logs, the last 100 lines). The log is read before and after, so only the new lines count. No websocket is needed on the server side, so it works while nobody has the page open. - CPU and memory come from Wings' server list, one request per node.
- The values are stored in
texusperf_samples; old samples are deleted after the retention time.
The commands show up in the server's console, three short lines per sample. Servers that never answer the tps command (vanilla, Forge, Fabric) are asked less and less often: after three silent runs every 10 minutes, later every 30 and then every hour. The Performance tab tells the customer why there is no data.
Settings
Under Admin > Extensions > Minecraft Performance:
| Setting | Meaning |
|---|---|
| Sample interval | Every 1, 2, 5 or 10 minutes (default 2). |
| Keep samples for | 1 to 30 days (default 7). The page shows the last 24 hours. |
| Lag spike below | TPS value under which a sample counts as a lag spike (default 18). |
| Which servers | Automatic: eggs whose name looks like Minecraft Java (Paper, Purpur, Spigot, Bukkit, Pufferfish, Leaf, Folia and similar; Bedrock, proxies, Forge, Fabric and vanilla are left out). Or only the nests and eggs you tick. |
The page also shows how many servers are covered, how many samples are stored and when the job last ran, and has a button to delete all samples.
Permissions
- Seeing the tab needs the right to connect to the console (owner, admins and subusers with console access).
- "Refresh now" and the profiler need the right to use the console, because they send commands. Starting and stopping the profiler is written to the server's activity log.
Good to know
- Values come from the console output of Paper, Purpur and Spigot (
TPS from last 1m, 5m, 15m,Server tick times (avg/min/max),There are x of a max of y players online). Servers with other output formats show no TPS. - A server has to be running; stopped servers leave a gap in the graphs.
- The console log of Wings holds 100 lines. On a very busy console the answer can scroll out before it is read; the sample is then skipped.
- The profiler link is taken from the console. A link that was already there before stopping is ignored.
- Everything uses Pterodactyl's own Wings API; no core files are modified.
Requirements
- Pterodactyl Panel 1.15.x with Wings 1.11 or newer on all nodes
- Blueprint (beta-2026-08 or newer)
- The panel's cron job (
schedule:runevery minute), as Pterodactyl needs it anyway - A licence key from texus-addons.de, free with your purchase, for one panel
- Outgoing HTTPS from the panel to texus-addons.de
Installation
- Upload
texusperf.blueprintto/var/www/pterodactyl - Run
blueprint -install texusperf - Enter the licence key under Admin > Extensions > Minecraft Performance
Changelog
0.1.0
- First release: a Performance tab on the server page of Minecraft Java servers with live TPS (1, 5, 15 minutes), MSPT (average, minimum, maximum), player count, CPU and memory, a 24 hour history, a list of lag spikes and spark profiler reports with one click. Works without a plugin on Paper, Purpur and Spigot by reading the output of the console commands through Wings. Admin page for the servers covered, sample interval, retention and spike threshold.
Licence and download
One purchase = one licence = one panel. The licence is bound to one panel domain and the server it runs on. Subdomains count separately. You can move the licence at any time in your account.
After buying on sourceXchange or BuiltByBit, sign in here with your email address (BuiltByBit: redeem your activation code). You download the extension with the licence key built in, and every new version from your account.
Questions before buying? Ask on our Discord support server or at support@texus-addons.de.
Related

Crash & Log Insights
Tells customers in plain words why their server crashed or will not start, and notices crashes by itself.
Usage Statistics
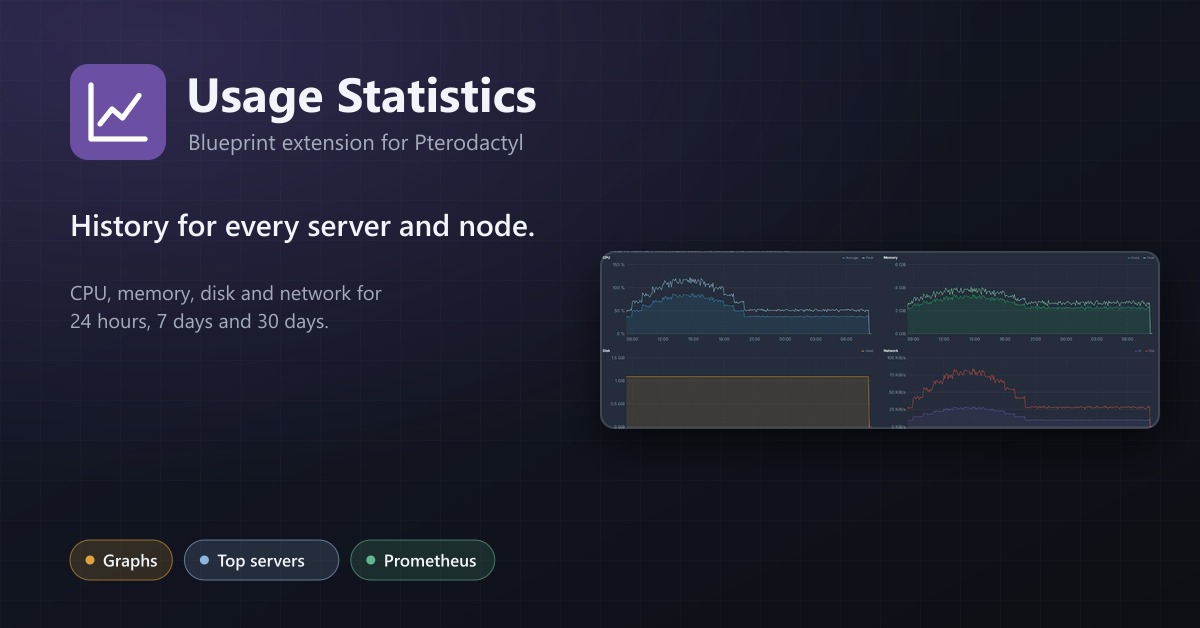
CPU, memory, disk and network history per server and node, graphs for admins and users, Prometheus export.
Bedrock Crossplay
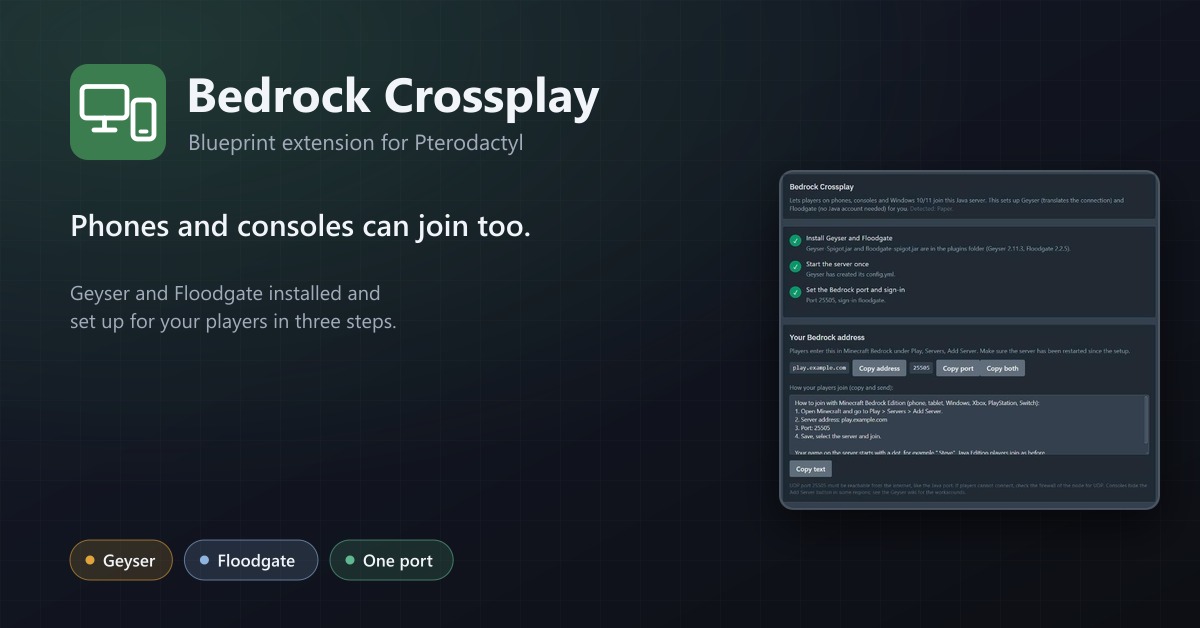
Let phones and consoles join Java servers: Geyser and Floodgate installed, a port assigned and the settings applied in three steps.