 texus Addons und Themes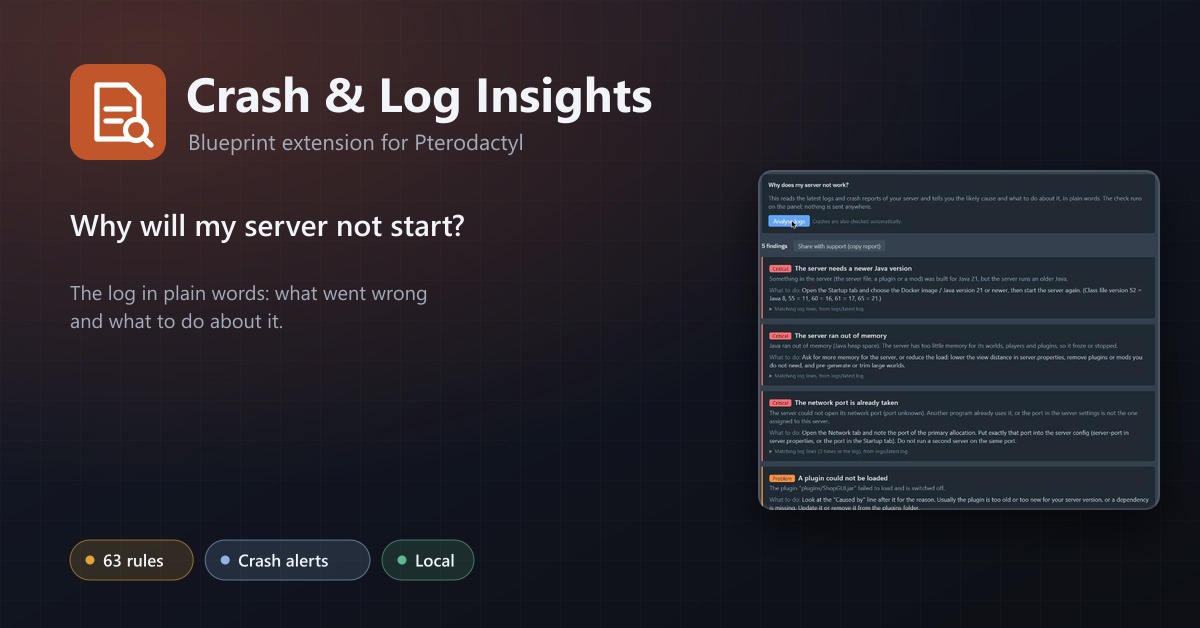
Crash & Log Insights
Tells customers in plain words why their server crashed or will not start, and notices crashes by itself.
9,99 €
- Version 0.1.0, updated 14 October 2026
- For Pterodactyl Panel 1.15.x with Blueprint
- No core files modified, installs and removes with Blueprint
- One licence for one panel, new versions included
Screenshots
Features
"My server doesn't work" is the ticket every host knows. The reason is almost always in the log, and nobody reads it. Crash & Log Insights adds a Diagnose tab to the server page that reads the logs and explains the problem in plain words.
What the customer gets
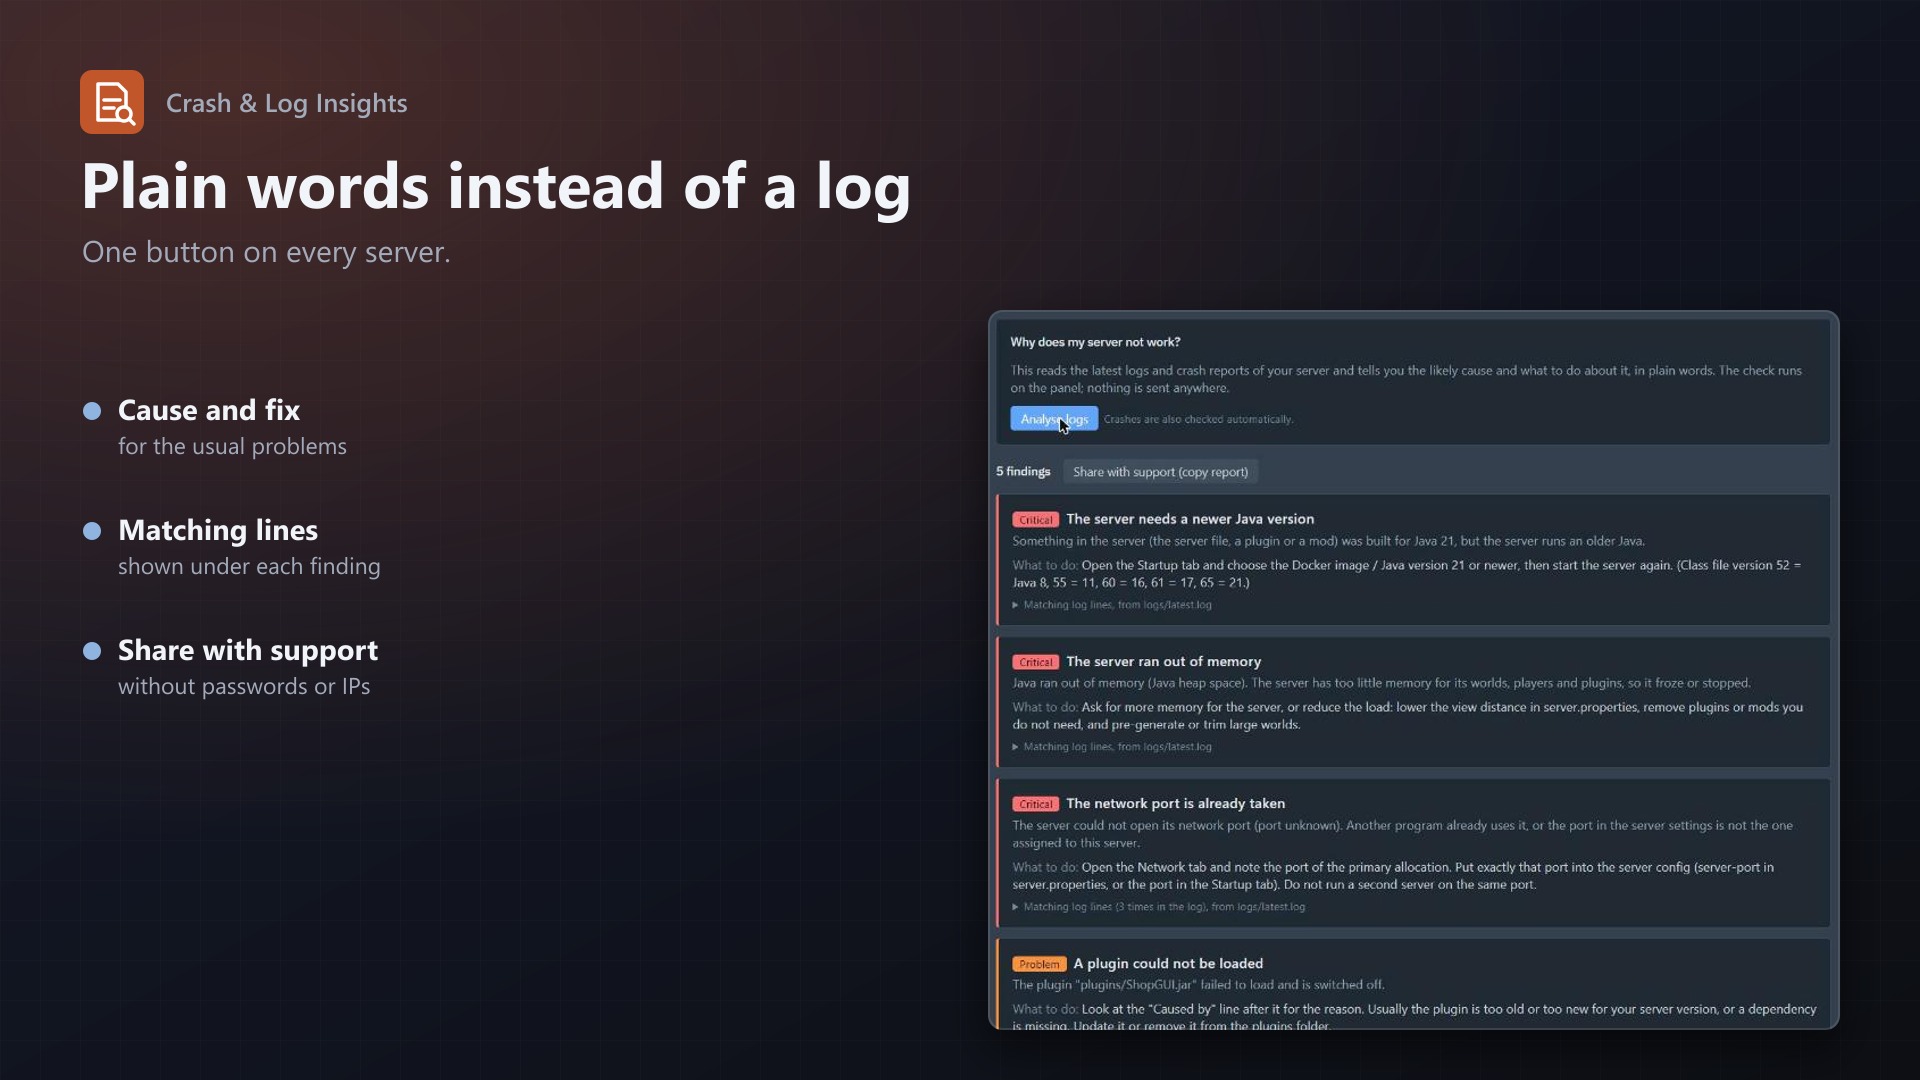
- One click, plain answers: "The server ran out of memory", "This needs Java 21: change the Java version in the Startup tab", "The Minecraft EULA is not accepted". Each finding has a severity, an explanation, the fix and the log lines it comes from
- Reads the right files:
logs/latest.log, the newest crash report,hs_errfiles and the console log through Wings, so servers of any game work - Share with support: copies a clean report; IP addresses, emails, tokens and passwords are removed
- Optional mclo.gs upload: off by default, clearly marked as sending the log to a third party
60+ rules, checked on your panel
- Java: out of memory, heap larger than the limit, wrong Java version (class file 65 = Java 21, 61 = 17, ...), missing or damaged jar, bad startup options, hs_err crashes
- Minecraft: EULA, port already in use, missing plugin or mod dependencies, unsupported API version, damaged or too new worlds, server.properties errors, lag, watchdog crashes, verify-username errors, proxy forwarding
- System: disk full, killed with exit code 137, segmentation faults, too many open files, DNS problems
- Games: Rust, Source engine (CS2, GMod, TF2), Terraria and tModLoader, Valheim
- Nothing is sent anywhere: the analyser is plain PHP on your panel
Automatic mode
- Finds servers that stopped on their own (not by Stop, Restart or Kill), analyses them and keeps the diagnosis
- Optional email to the owner with the likely cause and the fix, limited to one per server every few hours
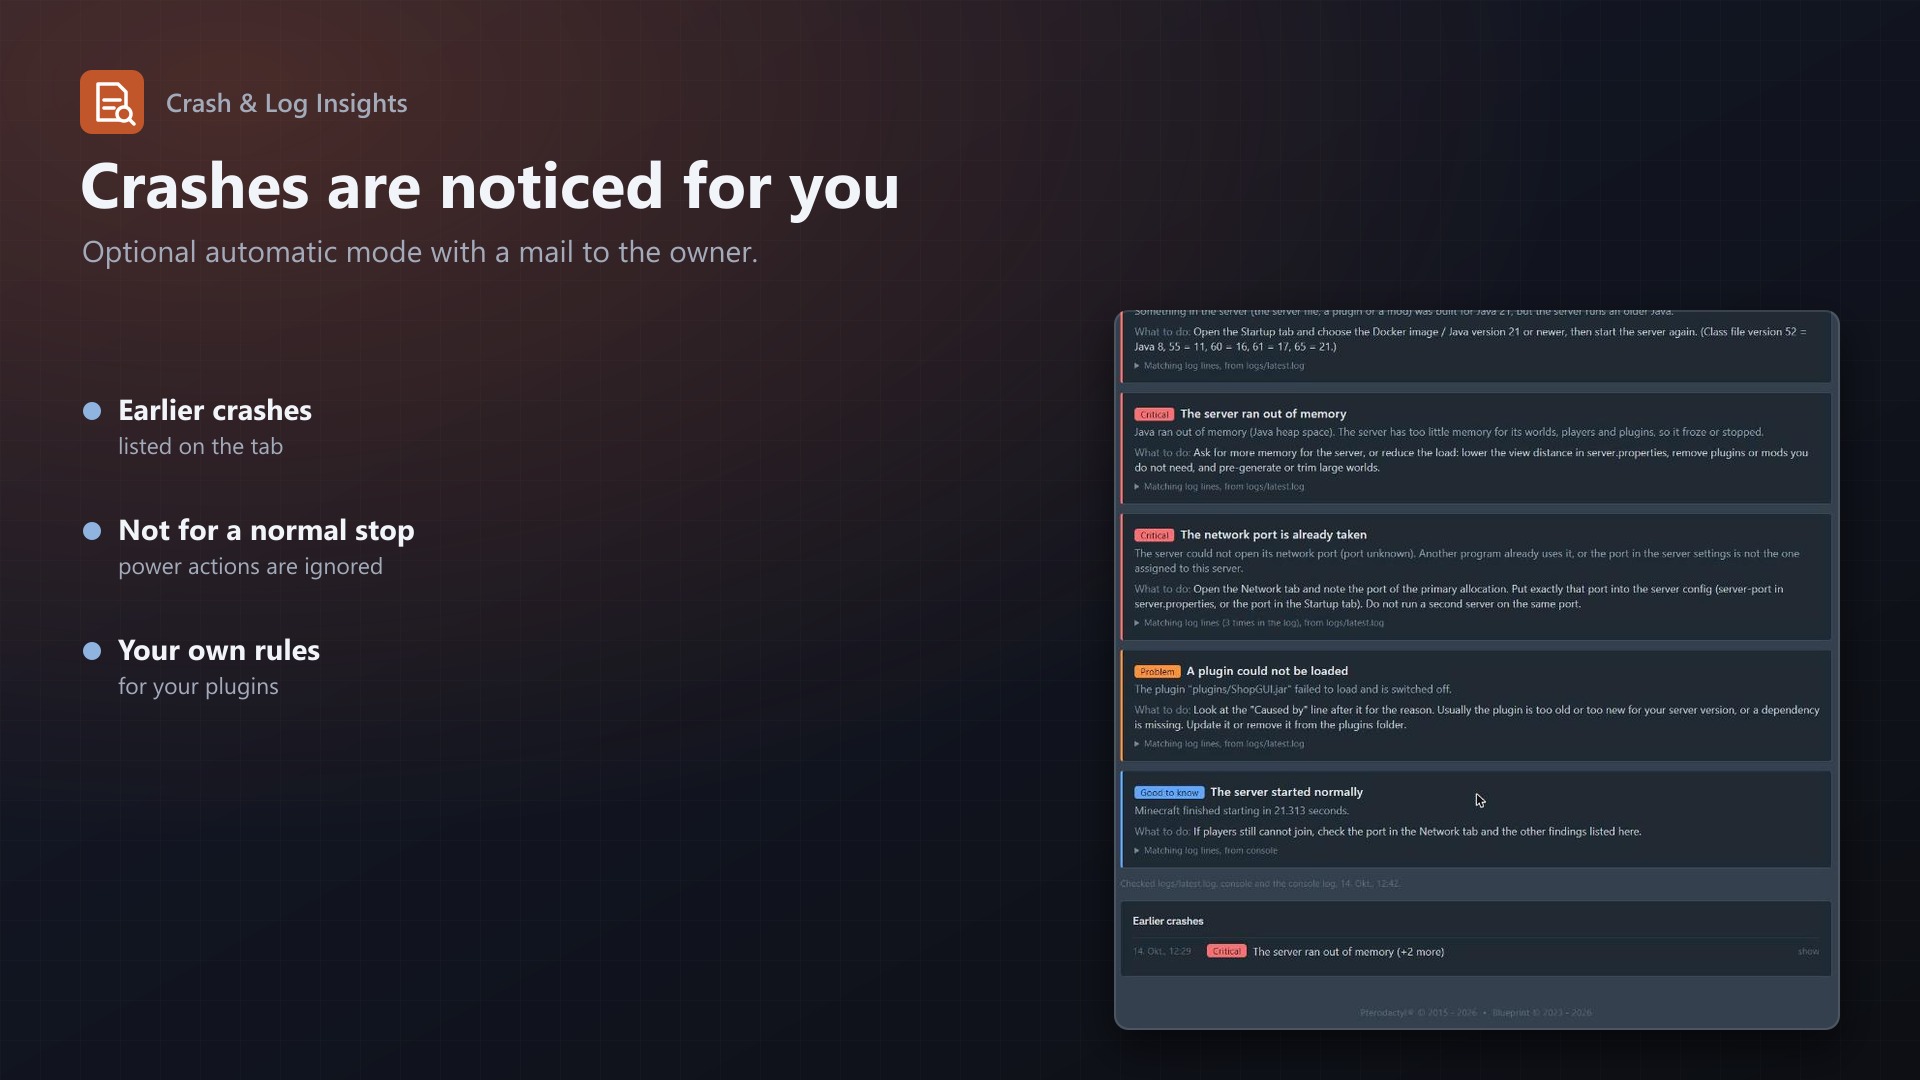
- Customers see their last crashes on the tab, you see all of them in the admin area
Under your control
- Add your own rules: regular expression, severity, title, explanation, fix. Patterns are checked before they are saved and slow ones are refused. A test box shows what a pasted log gives
- Switch the extension on or off per egg
- Console or file read permission needed on the server; every analysis goes to the activity log
Documentation
A Blueprint extension that tells customers why their server crashes or does not start.
A customer opens a ticket: "my server doesn't work". The answer is nearly always in the log, but nobody reads it. Crash & Log Insights adds a Diagnose tab to the server page. One click reads the logs and shows the likely cause and the fix in plain words: "The server ran out of memory", "Java 21 is needed, change the Java version in the Startup tab", "The EULA is not accepted". Hosts get fewer tickets, and the tickets that remain come with a clean report.
What customers see
- Analyse logs: reads
logs/latest.log, the newest file incrash-reports/, the newesths_err_pid*.logand the console log, and runs the rules over them. Servers without these files (Rust, Source games, Terraria, Valheim, ...) are checked from their console log. - Findings: one card per problem with a severity (critical, problem, warning, good to know), a plain title, an explanation, what to do, and the log lines that matched (and the
Caused bylines after them). - Share with support: copies a report with the findings and the last log lines. IP addresses, email addresses, tokens, passwords and keys are removed from it.
- Upload to mclo.gs (only if the admin switched it on): sends the cleaned log to mclo.gs and shows the link.
- Earlier crashes: the last incidents found by the automatic mode, with their diagnosis.
The rules
More than 60 built-in rules, kept as data in app/Rules.php. Each has a regular expression, a severity, a title, an explanation and a fix, and can use values from the match in its text (the plugin that is missing, the Java version that is needed, how often it happened).
- Java: OutOfMemoryError, "Could not reserve enough space", native memory, wrong startup options, a Java version that is too old (class file version 65 means Java 21, 61 Java 17, 60 Java 16, 55 Java 11, 52 Java 8, with the fix "change the Java version in the Startup tab") or too new, missing server file, damaged jar,
hs_errcrashes, StackOverflowError. - Minecraft: EULA not accepted, port already in use, missing plugin dependency, plugin that fails to load or enable, unsupported API version, Forge/Fabric missing or incompatible mods, Mixin errors, damaged or too new world files,
server.propertieserrors, "Can't keep up!", "Failed to verify username", offline mode, watchdog crash, crash reports, Velocity/BungeeCord forwarding, database connection failures. - System: disk full or over quota, killed with exit code 137 or "Out of memory", segmentation faults, permission denied, too many open files, DNS failures, missing libraries, wrong CPU architecture, a server that was close to its memory limit before it stopped.
- Games: Rust (Oxide plugins, Steam), Source engine (SourceMod plugins, maps, updates, GSLT token), Terraria and tModLoader (world, mods, memory), Valheim (password rules, BepInEx).
Run php tests/rules-test.php to check them: every rule is fed a realistic sample log and the diagnosis is asserted. The analyser is plain PHP and calls nothing outside; the logs are checked on your panel.
Custom rules
Under Admin > Extensions > Crash & Log Insights > Custom rules you can add your own: name, regular expression (up to 300 characters, written without delimiters), severity, title, explanation and fix. %1 to %9 in the texts are the parts of the match in parentheses, %count is how often it matched. A pattern is tried before it is saved: it must be a valid expression, must not match an empty text and must not be slow (nested repeats such as (a+)+ are refused). Rules can be switched off or deleted. A box on the same page runs the analyser over a pasted log, so you can test a rule at once.
Automatic mode
Off by default. When on, a scheduled job runs every minute:
- It asks each node for the state of its servers (one request per node, like the panel's server list).
- A server that was running (or starting) at the last look and is offline now, or that started over (its uptime is lower than before), counts as stopped on its own. If someone pressed Start, Stop, Restart or Kill, or a schedule ran, in the last 3 minutes (activity log), it is ignored.
- The logs of that server are analysed. When there is a critical or problem finding, the diagnosis is stored in an incident (warnings and notes ride along but do not make an incident). A server that was using more than 92 percent of its memory at the last look gets a note about it, because a server killed for memory leaves no message in its log.
- Optionally the owner gets a short email (plain text, with the likely cause, the fix and a link to the Diagnose tab), at most one per server in the number of hours you set (default 6).
Incidents show up on the Diagnose tab of the server and in the admin area (server, time, diagnosis, whether a mail went out). After a crash the same server is left alone for 10 minutes, so a crash loop is one incident.
Settings
Under Admin > Extensions > Crash & Log Insights:
| Setting | Meaning |
|---|---|
| Automatic mode | Find servers that stopped on their own and analyse them (default off). |
| Email the server owner | Send a short message after such a crash, with a rate limit per server (default off, 6 hours). Uses the mail settings of the panel. |
| Upload to mclo.gs | Show the upload button (default off). The log goes to a third party; IPs, emails and tokens are removed first. |
| Keep incidents for | 1 to 365 days (default 30). |
| Eggs | Tick the eggs the extension is on for (default all, eggs created later are on). |
Permissions
- Opening the tab, analysing and uploading need the console or file read permission of the server. Owners and admins always have them. Subusers without either permission get a 403.
- Every analysis is written to the server's activity log (
server:logs.analyse,server:logs.upload).
Good to know
- Everything is read through Wings: the file API (
logs/,crash-reports/, the server root) and the console log that Wings keeps (the last 100 lines). Wings answers a missing file with an error, so folders are listed first. Nothing is installed on the servers. - Only the end of a long log is read (about 400 KB, plus the start of it); files above 30 MB are skipped.
- The "Exit code: 137 / Out of memory" lines that the panel's console shows come from Wings itself and are normally not part of the logs that can be fetched afterwards, so for killed servers the memory note of the automatic mode and Java's own errors are the evidence. The rules for these lines are there for logs pasted or uploaded by customers.
- The automatic mode sees a state change once a minute. A server that Wings restarts by itself within a minute is recognised by its lower uptime; one that crashes and recovers within the same minute is not.
- Analysis and automatic mode need the licence. Stored incidents stay visible without it.
- No core files are modified.
Requirements
- Pterodactyl Panel 1.15.x with Wings 1.11 or newer on all nodes
- Blueprint (beta-2026-08 or newer)
- The panel's cron job (
schedule:runevery minute), as Pterodactyl needs it anyway - Working mail settings in the panel, if you use the email
- A licence key from texus-addons.de, free with your purchase, for one panel
- Outgoing HTTPS from the panel to texus-addons.de (and to api.mclo.gs, if you use the upload)
Installation
- Upload
texuslogs.blueprintto/var/www/pterodactyl - Run
blueprint -install texuslogs - Enter the licence key under Admin > Extensions > Crash & Log Insights
Changelog
0.1.0
- First release: a Diagnose tab on the server page that reads the latest log, the newest crash report, hs_err files and the console log, checks them against more than 60 built-in rules (Java memory and version problems, EULA, ports, plugin and mod dependencies, damaged worlds, lag, disk, killed servers, and common errors of Rust, Source games, Terraria and Valheim) and tells the customer the likely cause and the fix in plain words. Copyable support report with IPs, emails and tokens removed, optional upload to mclo.gs, automatic mode that analyses servers that stopped on their own and emails the owner (rate limited), custom rules and a list of recent incidents in the admin area.
Licence and download
One purchase = one licence = one panel. The licence is bound to one panel domain and the server it runs on. Subdomains count separately. You can move the licence at any time in your account.
After buying on sourceXchange or BuiltByBit, sign in here with your email address (BuiltByBit: redeem your activation code). You download the extension with the licence key built in, and every new version from your account.
Questions before buying? Ask on our Discord support server or at support@texus-addons.de.
Related
Minecraft Performance
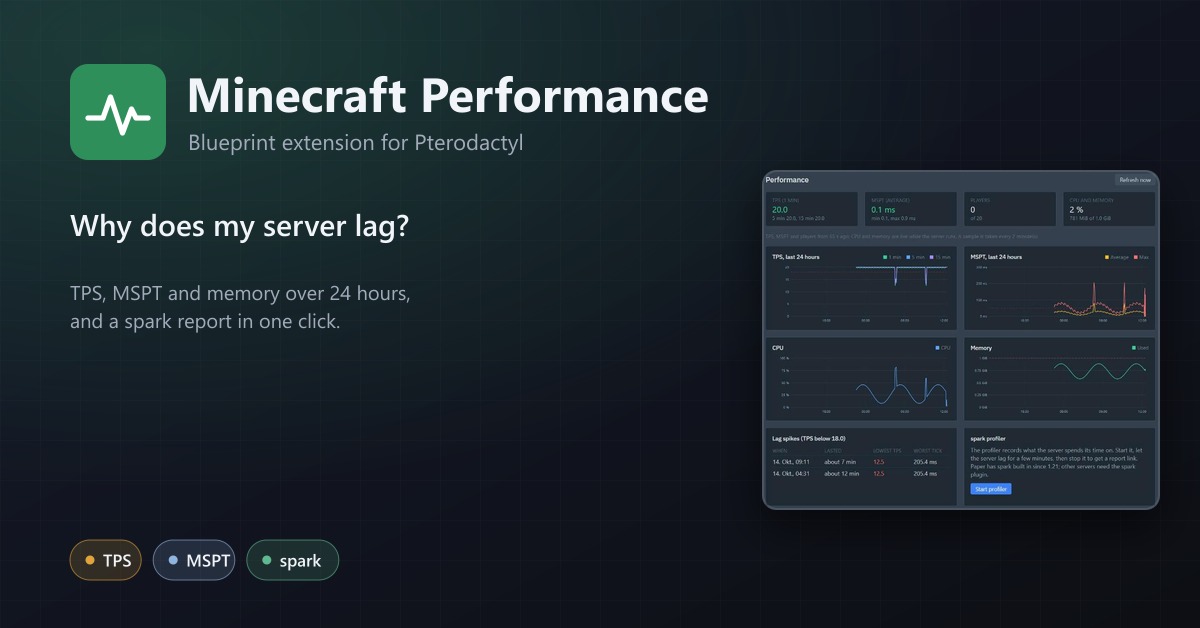
TPS, MSPT, players and memory per Minecraft server with 24 hours of history, lag spikes and the spark profiler in one click.
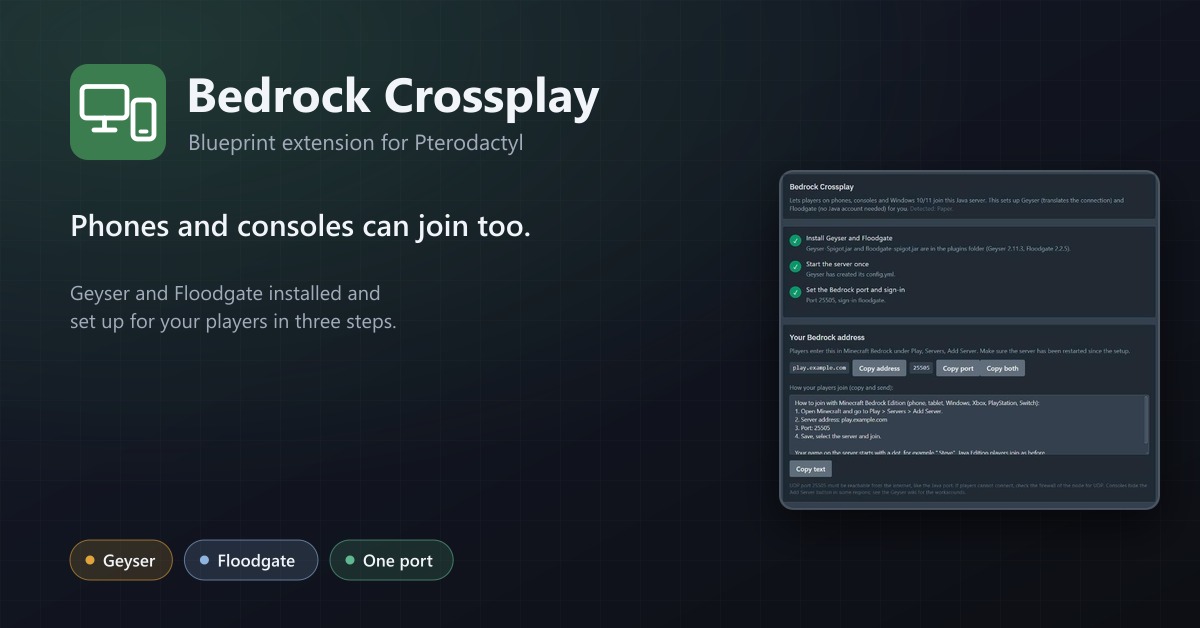
Bedrock Crossplay
Let phones and consoles join Java servers: Geyser and Floodgate installed, a port assigned and the settings applied in three steps.
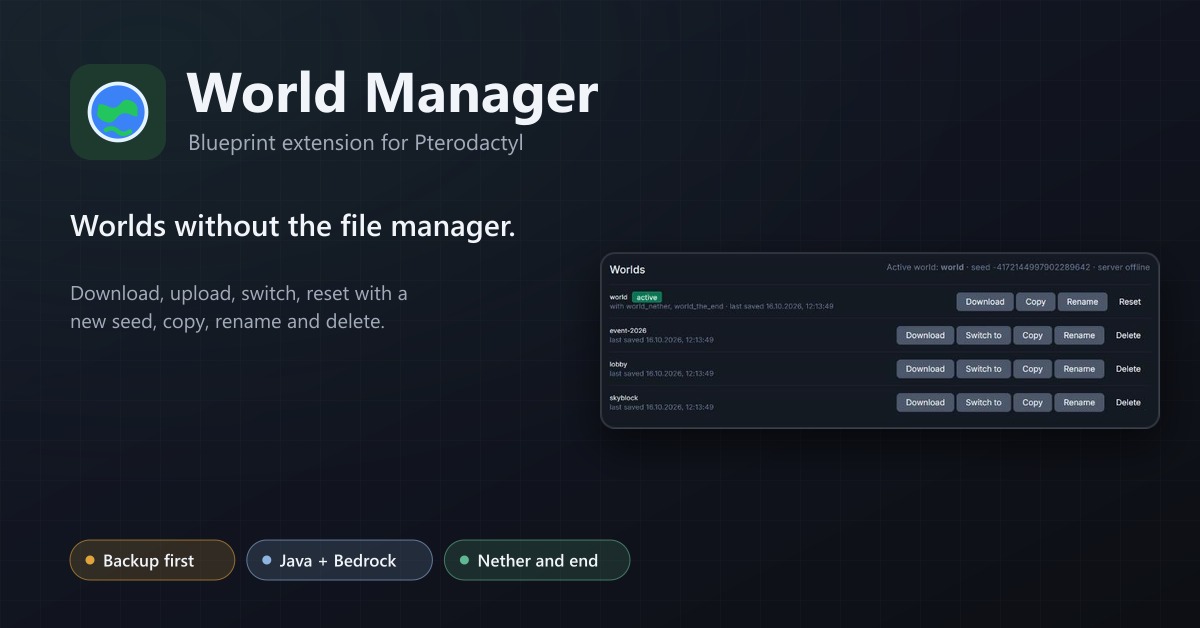
World Manager
A Worlds tab for Minecraft servers: download, upload, switch, reset with a new seed, copy, rename and delete worlds, with a backup first.